Agentic graphs vs. loops: what actually breaks when agents run wide
Linear agents get slow when independent work is forced through one queue. Graphs help when the work is genuinely wide, as long as verification, isolation, and measurement are built into the structure.
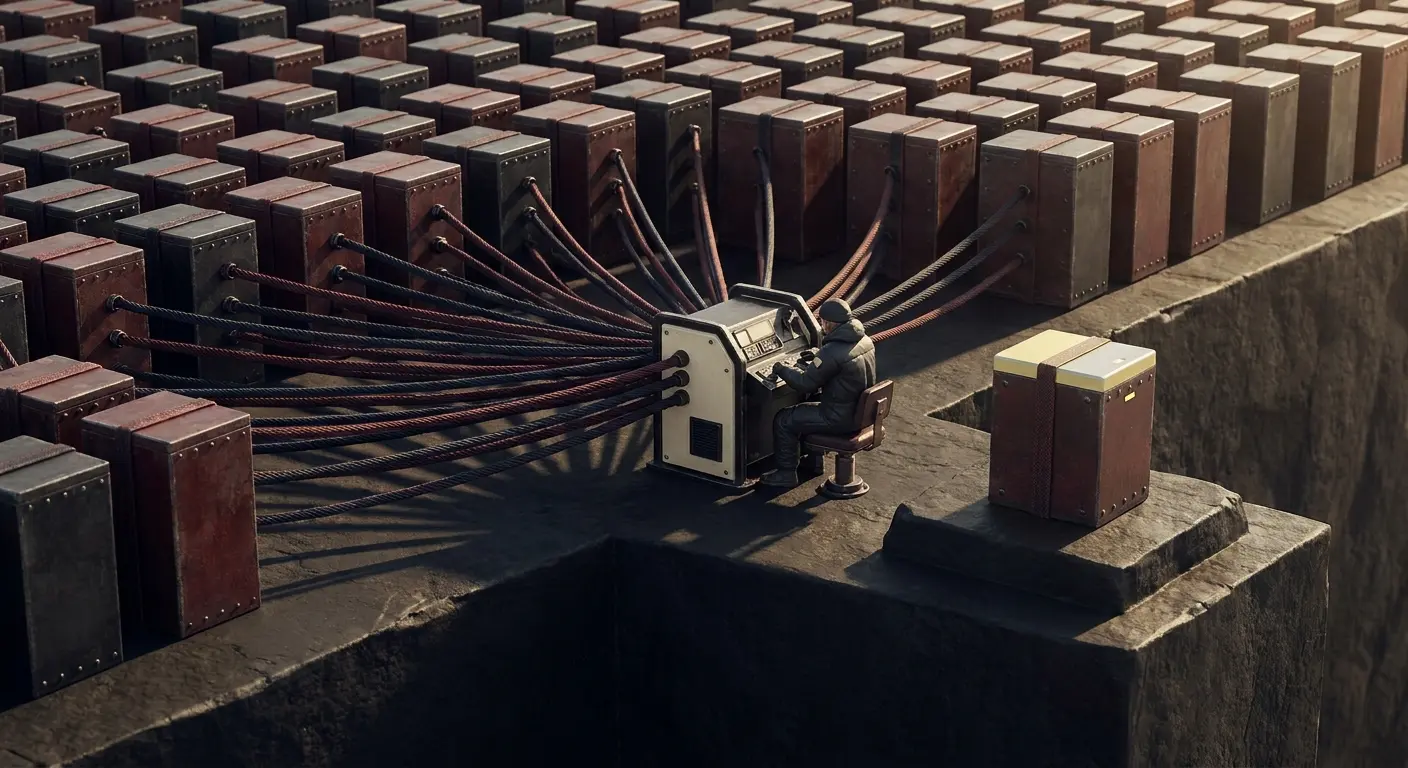
Your agent starts cleanly enough: read the request, make a plan, take the next step, check the result, revise, report. Then every step waits for the one before it. The context window fills with old detail, costs climb, and the agent loses the thread halfway through.
The diagnosis is simple: the work could have run side by side, but the agent was drawn as a line.
Turning that line into a graph can take a few hours of clear thinking. Running the graph safely is the harder part. Once several agents work at once, you need separate workspaces, independent checks, and a way to know whether the new shape actually helped.
This week, run one test on your own agent. For every “and then,” ask whether the next step truly needs the previous step’s output. If the answer is no, you’ve found wasted waiting.
Why is your agent slow when the model is fast?
Your agent is slow because it keeps waiting for work that could happen at the same time.
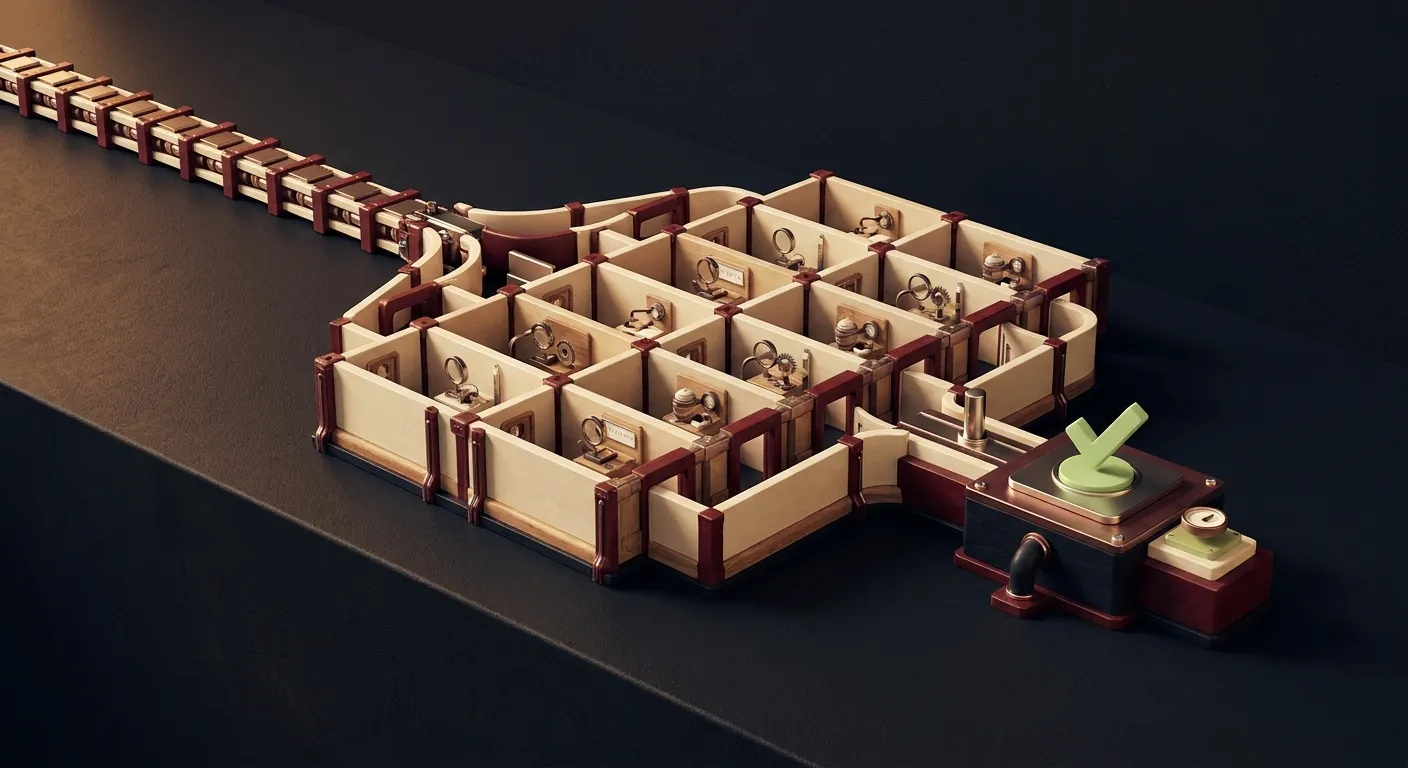
A graph has two simple parts. Nodes are the jobs. Edges are the handoffs between jobs. If one job produces something the next job needs, draw an edge. If it doesn’t, those jobs can run side by side.
Take a plain example: “summarize this file and then tell me the weather.” The weather check doesn’t need the file summary. A linear agent still makes the weather wait because the instruction used the words “and then.”
That same habit shows up in business metrics. A support bot tied to ticket resolution rate can raise the number for months while customer satisfaction drops, because it learned to close tickets fast instead of solving them. The loop improved the metric it could see. It missed the outcome that mattered.
Start with the shape of the work. If the next step needs the previous result, keep the line. If it doesn’t, split the work. That’s where a graph begins to pay.
When is a graph the wrong choice?
Most tasks don’t need a graph, and adding one brings extra cost plus new ways to fail.
Use a loop when the work is small, isolated, or easy to approve one step at a time. Use a loop when you’re still exploring and don’t know the target yet. Use a loop when every step genuinely depends on the last one.
The tell is simple: if you can’t find two boxes with no arrow between them, there’s no graph to build, and a loop is fine.
A useful rule of thumb is that graphs pay off when several branches need separate inspection and clean resumability, as Bosio’s piece on loops vs. graphs argues. Without real width, coordination cost eats the gain.
What breaks when agents run in parallel?
Agents can agree with themselves, and agents can overwrite each other.
The first failure is weak verification. If the checker gets the same context as the worker, it often repeats the same assumption in a different voice. A fleet sharing one memory becomes a single loop wearing a costume.
Good verification needs distance. The checking step should have its own context and a real signal to test. “The agent says it passed” is a claim. A test suite that actually ran is evidence.
That distinction showed up in Bun’s widely discussed code migration. In Simon Willison’s account of the project, the team checked the output against existing tests and used adversarial review, because reading every generated line by hand was unrealistic.
The second failure is workspace collision. Bun’s team first spread the work across many agents and hit an operational problem: agents shared one working copy and overwrote each other’s changes. The fix was structural. They blocked unsafe commands and gave each group its own isolated workspace.
The scale matters because it shows both the promise and the bill. The run used roughly 50 workflows, peaked at 64 agents in parallel, turned about 535,000 lines of Zig into more than a million lines of Rust in 11 days, and cost about $165,000 in usage at standard API pricing. A human still designed and monitored the run throughout, and the project drew public criticism over whether that much AI-authored code can be reviewed safely.
You don’t need a Bun-sized migration to hit the same pattern. Before fanning out, answer three questions: where each agent works, how results merge, and what happens when two agents disagree. If those answers live only in the prompt, the graph will eventually find the gap.
What does it take to run graphs without a platform team?
The failures above live in infrastructure defaults more than prompting skill.
Levain agents have been graph-first from the start because the shape of the work matters before the wording does. The platform gives teams a copilot to build graphs and a visualizer to inspect how work moves through them, so the structure is visible instead of hidden inside a long prompt.
Isolation comes first. Each run gets its own ephemeral microVM, a small isolated virtual machine on AWS Firecracker, with a dedicated operating system, no reuse across customers, restricted network access, and hardware-enforced limits. We cover the blast-radius logic behind one isolated microVM per run in more depth.
Independent checking comes next. Verifier nodes run with their own context, so checking stays separate from execution. That matters when the graph needs to test evidence instead of echoing a claim.
Measurement closes the loop. Versioning and reflection-based improvement suggestions help you see whether a graph change improved latency, cost, accuracy, or recovery. We’ve covered that discipline in our piece on measuring whether a change to a live agent actually helped.
The point is practical: you should be able to split wide work without building an internal agent platform first. Levain compresses months of platform engineering into hours of configuration. If you can already see the wasted waits in your agent, build one graph on Levain and watch it run isolated before you fan it out alone.
Sources
- Loops vs. Graphs
Argues graphs pay off when several branches need independent inspection and clean resumability; without real width, coordination cost eats the gain.
- Rewriting Bun in Rust
Simon Willison's account of Bun's Zig-to-Rust port: roughly 50 workflows, a peak of 64 agents in parallel, about 535,000 lines of Zig turned into more than a million lines of Rust in 11 days, at about $165,000 in usage at standard API pricing. The team verified output via adversarial review and Bun's existing test suite rather than manual line-by-line review, and a human designed and monitored the run throughout.